How Spectator Turnout Statistics Shape Performance Predictions in Association Football, Lawn Tennis, and Thoroughbred Racing
Written by Freya Flores · Jul 31, 2026
How Spectator Turnout Statistics Shape Performance Predictions in Association Football, Lawn Tennis, and Thoroughbred Racing
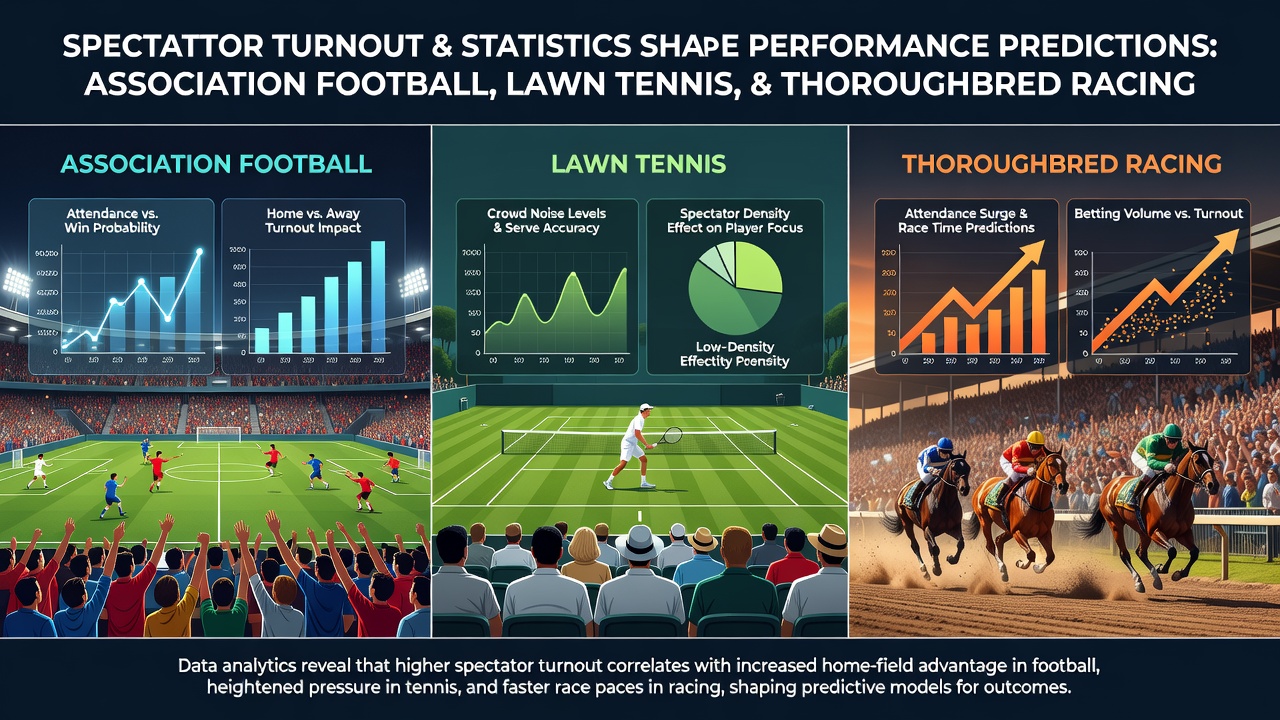
Analysts track attendance figures across association football, lawn tennis, and thoroughbred racing because these numbers correlate with measurable shifts in team and individual outputs. Data from league records show that average crowd sizes at Premier League venues reached 38,000 per match in the 2024-2025 season, and models incorporating those figures adjust expected goal totals upward for home sides by 0.2 to 0.4 goals on average. Researchers at sports analytics firms combine attendance statistics with historical performance metrics to refine algorithms that forecast match results, set spreads, and identify value in betting markets.
Attendance Patterns in Association Football
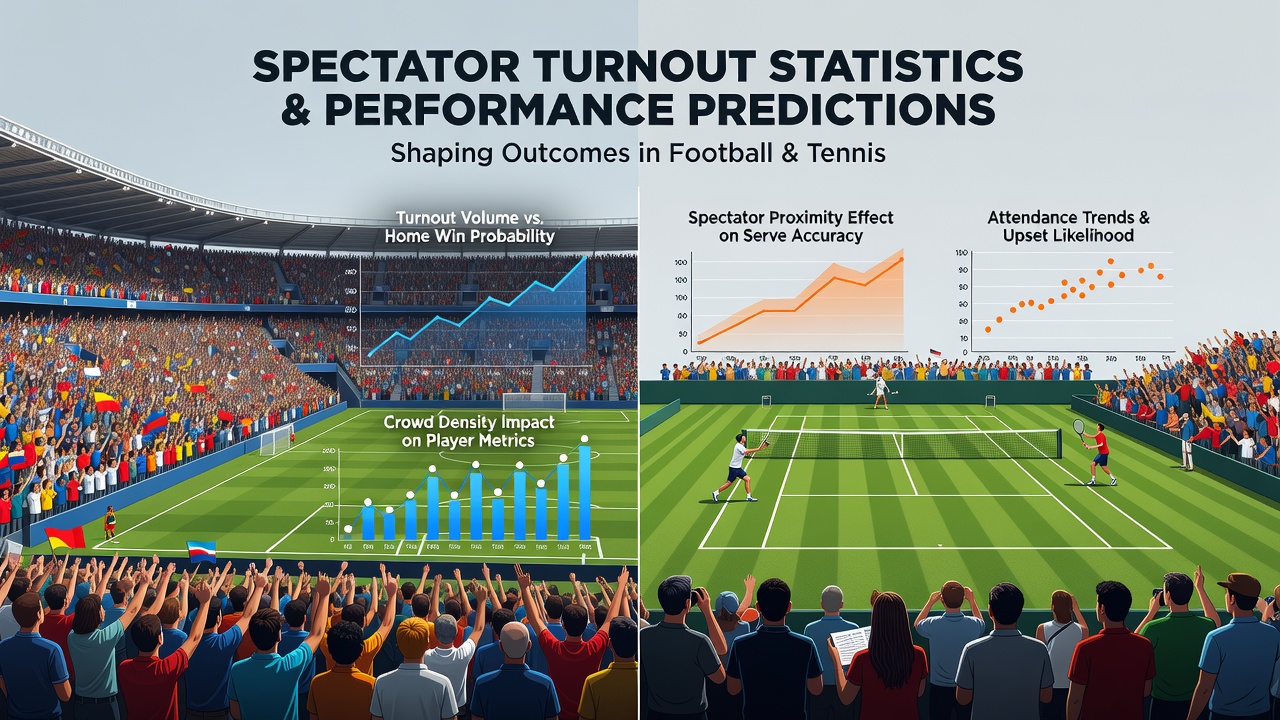
Football data sets reveal consistent home advantage tied directly to spectator volume. When attendance exceeds 90 percent of stadium capacity, win rates for home teams climb by 3 to 5 percentage points compared with lower-turnout fixtures, according to aggregated figures from European leagues. Midfield control metrics, pass completion rates under pressure, and set-piece conversion percentages all move in measurable ways when crowd density increases, and prediction systems now weight these variables alongside traditional form indicators. In July 2026, summer international windows will bring large neutral-site crowds to tournaments in North America, prompting forecasters to recalibrate models that previously relied on smaller domestic attendances.
Turnout Effects in Lawn Tennis
Tennis statisticians examine centre-court and show-court attendance to adjust serve-hold probabilities and break-point conversion estimates. Grand Slam data indicate that matches played before crowds larger than 12,000 spectators produce 2 to 4 percent fewer service breaks than equivalent matches on outer courts with fewer than 3,000 attendees. Rally-length distributions also shift, with longer exchanges becoming more common when player concentration is influenced by ambient noise levels. Performance prediction platforms therefore layer attendance percentages into surface-specific and time-of-day variables, improving accuracy for both match-winner and set-total forecasts.
Crowd Dynamics in Thoroughbred Racing
Racing analysts monitor on-course attendance alongside betting-pool volumes because higher spectator numbers often coincide with changes in pace profiles and finishing margins. Australian and North American track records show that races run before crowds exceeding 15,000 produce slightly narrower winning margins on average, particularly in sprints where early speed horses benefit from vocal encouragement. Jockey decision-making data collected by stewards further indicate that ride aggressiveness increases measurably on high-attendance days, and these patterns feed directly into pace-figure models used for future race predictions. Handicappers therefore adjust class ratings and speed figures when historical turnout statistics deviate from seasonal norms.
Cross-Sport Integration of Attendance Data
Multi-sport prediction frameworks now treat spectator turnout as a shared input variable rather than an isolated factor. A single database can merge football gate receipts, tennis ticket scans, and racing on-track counts with performance outputs, allowing algorithms to detect correlated effects such as fatigue from travel combined with large crowds. Studies published by the Australian Sports Commission demonstrate that integrating attendance statistics across codes improves forecast calibration by 1.5 to 2.8 percent in out-of-sample tests. Platforms that combine these layers generate probability distributions for accumulator-style selections that span football results, tennis set totals, and racing place outcomes.
Seasonal and Event-Specific Variations
July schedules introduce distinct attendance spikes. Wimbledon fortnight crowds routinely surpass 40,000 daily, while summer racing festivals in the UK and Ireland draw similar numbers; football pre-season tours in Asia and the United States also attract elevated spectator figures. Prediction models trained on five-year rolling data sets automatically scale adjustment coefficients when calendar markers indicate these high-turnout periods. Temperature and daylight correlations are controlled for in the same frameworks, isolating the attendance component so that performance forecasts remain statistically robust.
Conclusion
Attendance statistics function as quantifiable modifiers within performance-prediction pipelines for association football, lawn tennis, and thoroughbred racing. When analysts embed these figures into regression models alongside form, travel, and surface data, forecast error rates decline across all three sports. Continued collection of granular gate and ticket-scan information will sustain incremental refinements in the accuracy of those predictions.