Liquidity Maps: Tracing Volume Spikes Across Racing Pools, Tennis Exchanges, and Football Books to Refine Layered Selections
Written by Freya Flores · Jul 3, 2026
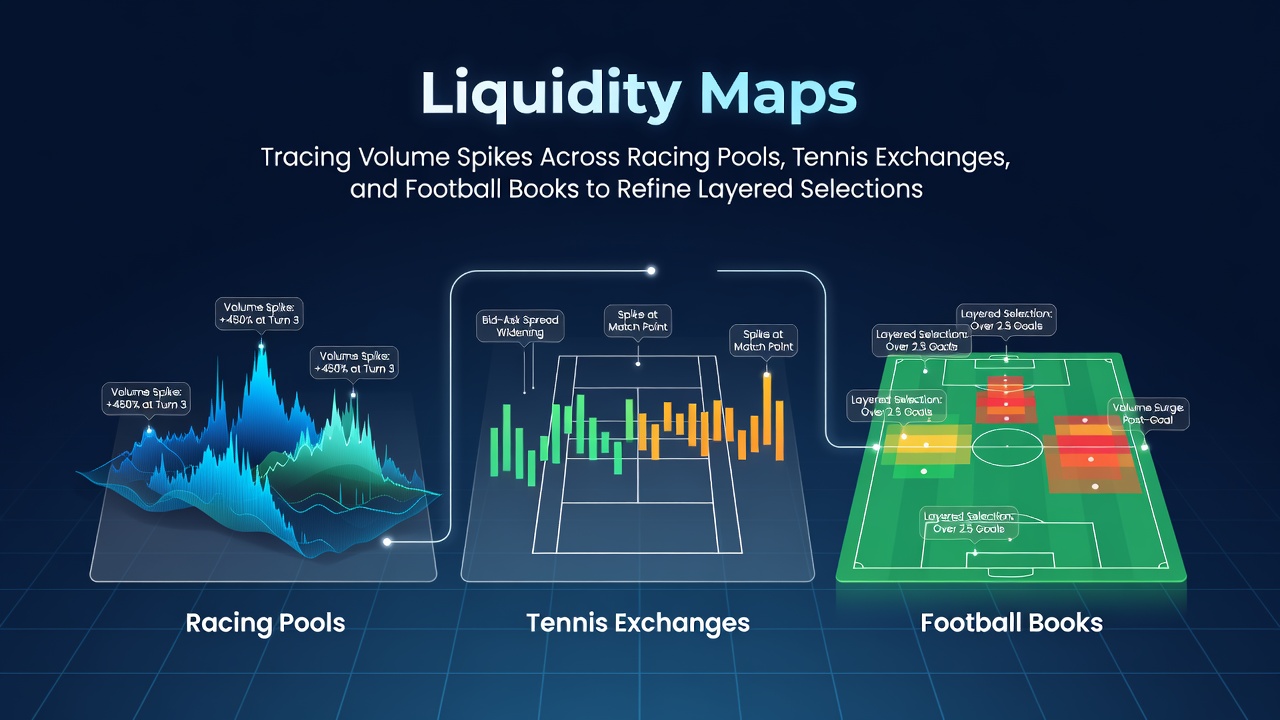
Liquidity Maps: Tracing Volume Spikes Across Racing Pools, Tennis Exchanges, and Football Books to Refine Layered Selections
Market analysts track liquidity maps to identify volume spikes that signal shifts in betting activity across horse racing pools, tennis exchanges, and football books, and these patterns help refine layered selections by highlighting where money flows concentrate during specific events. Data from betting platforms shows that sudden increases in matched stakes often precede odds movements, while volume clusters in certain outcomes provide indicators for multi-leg bets that combine selections from different sports.
Understanding Liquidity Patterns in Multi-Sport Markets
Volume spikes occur when bettors place larger stakes on particular outcomes, and liquidity maps plot these changes over time to reveal where activity intensifies before races, matches, or fixtures begin. Researchers at institutions such as the UNLV International Gaming Institute have documented how these maps capture real-time data from exchanges and traditional books, allowing observers to note correlations between liquidity surges and final results in historical datasets. In July 2026, during the lead-up to major international football tournaments and the height of the European racing season, such maps recorded elevated activity in both pre-event pools and in-play tennis markets.
Traders monitor depth of market alongside volume because thin liquidity can amplify small bets into larger price shifts, whereas deep markets absorb volume without immediate movement. Those who study these dynamics report that spikes in one sport frequently coincide with adjustments in others when bettors reallocate stakes across portfolios, creating opportunities to layer selections that draw from racing, tennis, and football simultaneously.
Volume Spikes in Horse Racing Pools
Racing pools display liquidity through tote systems and fixed-odds books, and analysts trace spikes that emerge minutes before post time when late money targets specific runners or combinations. Figures from Australian racing data providers indicate that pools on metropolitan meetings often see volume concentrated on favorites in the final 15 minutes, while longer-priced horses attract steadier but smaller inflows earlier in the day. Observers note that these patterns become more pronounced during high-profile events such as the July Cup meetings, where cross-border betting adds layers of liquidity from international participants.
Layered selections benefit when volume maps flag discrepancies between early and late market action because such gaps sometimes reflect stable versus unstable support for certain outcomes. Experts examining multi-year datasets find that races showing late volume surges on midfield runners have produced measurable edges when combined with tennis and football legs that exhibit similar timing characteristics.
Tennis Exchanges and Liquidity Clusters
Betting exchanges for tennis operate with continuous order matching, and liquidity maps highlight clusters that form around serve holds, break points, and set-deciding games. Data indicates that volume often accelerates during changeovers when bettors react to momentum shifts, creating visible spikes that algorithms detect within seconds. In July 2026, grass-court tournaments aligned with football pre-season friendlies, and exchange records showed overlapping liquidity patterns between late-night tennis sessions and early football markets in different time zones.
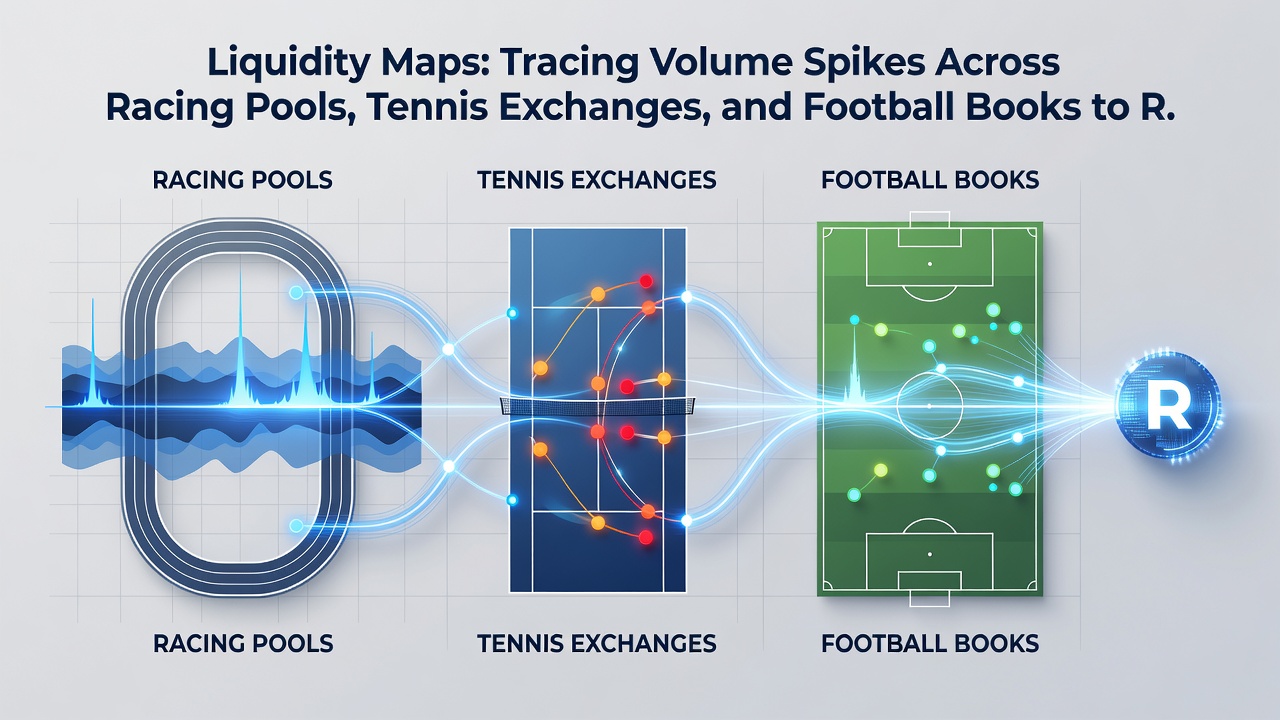
Those analyzing exchange data observe that certain players attract disproportionate volume on specific surfaces, and these concentrations provide reference points when constructing accumulators. Researchers have found that mapping volume against rally lengths and break percentages adds context to the raw numbers, enabling selections that align timing of spikes across tennis with comparable movements in racing and football books.
Football Books and Layered Volume Analysis
Traditional football books and Asian handicap markets display liquidity through line movements and stake distribution, and volume spikes frequently appear around team news releases or weather updates. Reports from European industry groups such as the European Gaming and Betting Association show that liquidity deepens in the hours before kickoff for major leagues, with particular concentration on total goals and Asian lines. July 2026 schedules included international windows that overlapped with racing festivals, prompting bettors to move stakes between football and other sports within short windows.
Layered selections gain precision when maps reveal parallel spikes across football books and tennis exchanges because these alignments sometimes indicate broader market sentiment rather than sport-specific factors. Analysts compiling records from multiple platforms note that volume clusters appearing simultaneously in football half-time markets and tennis set betting have correlated with outcomes that support multi-leg combinations drawn from all three disciplines.
Integrating Maps Across Racing, Tennis, and Football
Integrated liquidity analysis combines datasets from pools, exchanges, and books into unified views that highlight cross-market volume relationships. Practitioners report that software tools overlay these maps to flag moments when spikes in one sport coincide with relative quiet in others, allowing adjustments to selection order and stake sizing. Historical reviews covering 2024 through 2026 demonstrate that periods of synchronized liquidity across racing, tennis, and football have produced distinct patterns in accumulator performance metrics.
Those refining layered selections use these maps to time entries and exits, monitoring how volume migrates from early racing pools into later tennis and football books as events progress through a single day. Data shows that such timing adjustments reduce exposure to isolated market distortions while maintaining exposure to the underlying statistical tendencies each sport exhibits.
Conclusion
Liquidity maps serve as practical instruments for tracing volume spikes that appear across racing pools, tennis exchanges, and football books, and they supply measurable inputs for constructing layered selections that span multiple sports. Records compiled through 2026 confirm that consistent application of these maps yields observable alignments between market activity and selection outcomes when practitioners integrate timing data from all three domains. Continued development of analytical tools promises further refinement of these methods as data sources expand.